Sai Sudharsan currently holds the highest batting average in IPL history, with an average of 48.37 from 2,515 runs in 57 innings.KL Rahul is next at 46.15, while Vaibhav Sooryavanshi has already moved into the top three with an average of 44.70 after the 2026 season.
Batting average is one of the clearest ways to measure consistency because it considers how often a player is dismissed rather than simply counting how many runs he scores.That makes this statistic particularly useful when comparing prolific IPL run-scorers with batters who score quickly but get out more often.
The rankings can change depending on the qualification used.A player with only three or five innings can post a huge average, so this article separates the main career leaderboard from small-sample records and looks at important thresholds such as 1,000, 2,000, 3,000 and 5,000 IPL runs.
All statistics in this article are based on IPL records through the IPL 2026 final on May 31, 2026, unless a different season is stated. The 2026 tournament ran from March 28 to May 31 and consisted of 74 matches.
What Is Batting Average in IPL?
An IPL batting average measures how many runs a batter scores for every time he is dismissed.
The formula is:
Batting Average = Total Runs ÷ Number of Times Dismissed
Not-outs are therefore extremely important.
For example, Virat Kohli scored 675 runs in IPL 2026 and was not out four times in 16 innings. That means he was dismissed 12 times, giving him an average of:
675 ÷ 12 = 56.25
His 56.25 average was the best among the major-volume run scorers in the 2026 season.
A batter who scores 500 runs with five not-outs can have a higher average than another batter who scores 550 runs but is dismissed every time. That is why batting average should always be read alongside runs, innings, strike rate and sample size.
Highest Batting Average in IPL History
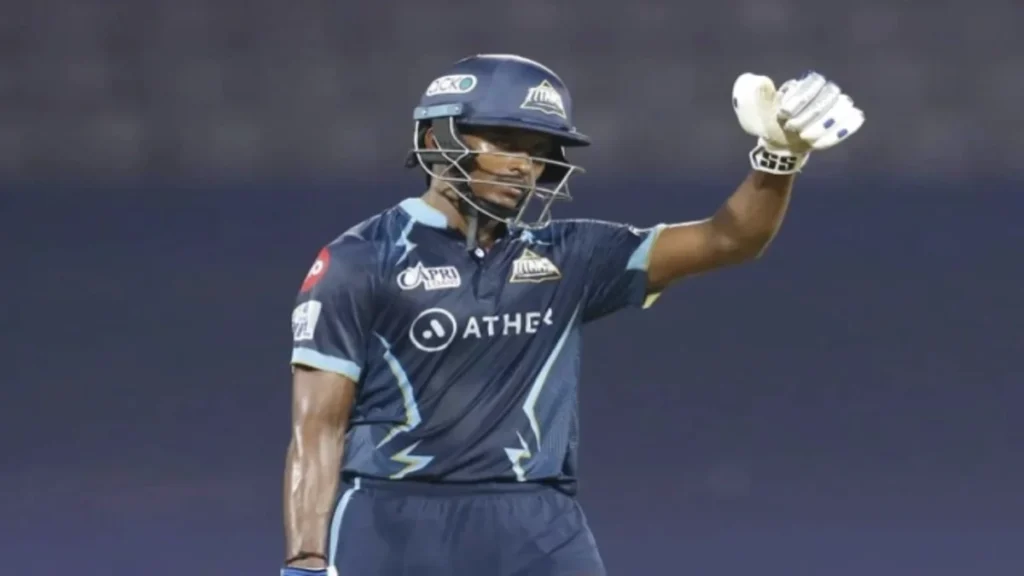
Using a 500-run career minimum for the main comparison gives a more meaningful leaderboard and removes very small IPL samples. This is an editorial qualification rather than an official IPL rule.
Some raw statistical tables can show players with averages above 50 after only a handful of innings.
For a career comparison, the following list focuses on players with at least 500 IPL runs.
| Rank | Player | IPL Innings | Runs | Batting Average | Strike Rate |
|---|---|---|---|---|---|
| 1 | Sai Sudharsan | 57 | 2,515 | 48.37 | 149.17 |
| 2 | KL Rahul | 150 | 5,815 | 46.15 | 139.15 |
| 3 | Vaibhav Sooryavanshi | 23 | 1,028 | 44.70 | 228.95 |
| 4 | Hashim Amla | 16 | 577 | 44.38 | 141.77 |
| 5 | Devon Conway | 28 | 1,080 | 43.20 | 139.72 |
| 6 | Heinrich Klaasen | 60 | 2,104 | 42.08 | 166.72 |
| 7 | David Warner | 184 | 6,565 | 40.52 | 139.77 |
| 8 | Virat Kohli | 275 | 9,336 | 40.42 | 134.80 |
| 9 | Shubman Gill | 131 | 4,598 | 40.33 | 142.09 |
| 10 | Lendl Simmons | 29 | 1,079 | 39.96 | 126.64 |
| 11 | Shaun Marsh | 69 | 2,477 | 39.95 | 132.74 |
| 12 | Chris Gayle | 141 | 4,965 | 39.72 | 148.96 |
| 13 | Jos Buttler | 136 | 4,646 | 39.71 | 149.73 |
| 14 | AB de Villiers | 170 | 5,162 | 39.70 | 151.68 |
| 15 | Tristan Stubbs | 43 | 980 | 39.20 | 151.23 |
| 16 | Josh Inglis | 16 | 544 | 38.86 | 173.25 |
| 17 | Ruturaj Gaikwad | 84 | 2,839 | 38.36 | 135.64 |
| 18 | MS Dhoni | 242 | 5,439 | 38.30 | 137.45 |
| 19 | Cameron Green | 42 | 1,029 | 38.11 | 151.10 |
| 20 | Shashank Singh | 42 | 905 | 36.20 | 161.61 |
The career leaderboard is led by Sai Sudharsan at 48.37, followed by KL Rahul at 46.15 and Vaibhav Sooryavanshi at 44.70. Current records also confirm Kohli’s 9,336 IPL runs and 40.42 career average after the 2026 campaign.
Who Has the Highest Batting Average in IPL?
Sai Sudharsan has the highest batting average in IPL history among the current career-record leaders, at 48.37.
He has scored 2,515 runs in 57 IPL innings, including three centuries and 20 fifties. His average is particularly impressive because it has been built across multiple seasons rather than a single short tournament.
KL Rahul is second with 5,815 runs at an average of 46.15 from 150 innings. His larger sample makes his figure especially significant because he has maintained an elite average across a much longer IPL career.
Vaibhav Sooryavanshi is third on the current list at 44.70. He reached 1,028 IPL runs in only 23 innings, with an exceptionally high strike rate of 228.95.
Best Batting Average in IPL Among Players With 1,000+ Runs
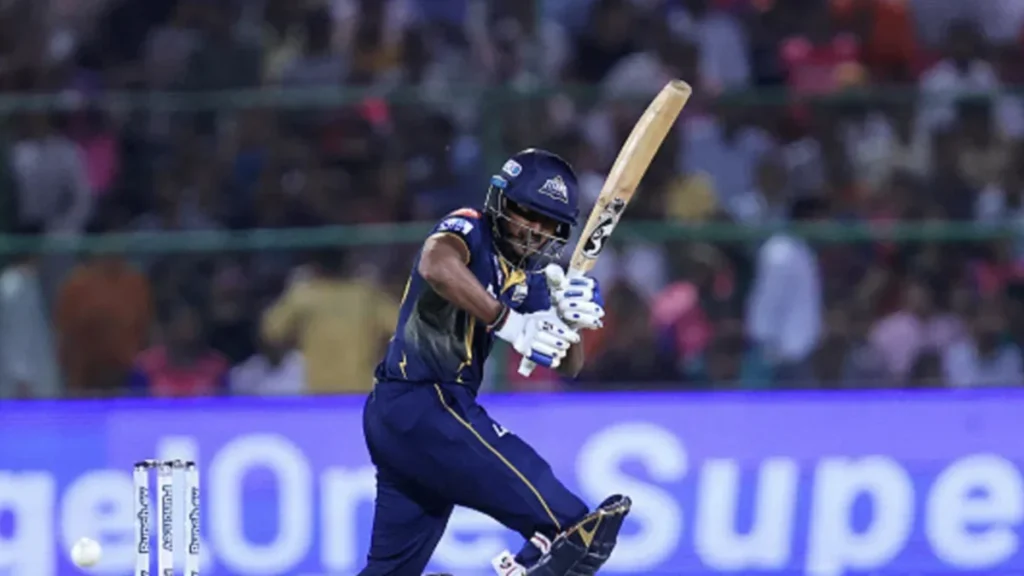
A 1,000-run qualification provides a useful middle ground between career longevity and small-sample performance.
Under this threshold, Sai Sudharsan remains No. 1 with a 48.37 average. KL Rahul is second at 46.15, while Vaibhav Sooryavanshi is third at 44.70.
This is important because some historic IPL averages come from players who had only a short run in the league. Requiring at least 1,000 runs makes the comparison more representative.
| Rank | Player | IPL Matches | Total Runs | Batting Average | Strike Rate |
|---|---|---|---|---|---|
| 1 | Sai Sudharsan | 57 | 2,515 | 48.37 | 149.17 |
| 2 | KL Rahul | 159 | 5,815 | 46.15 | 139.15 |
| 3 | Vaibhav Sooryavanshi | 23 | 1,028 | 44.70 | 228.95 |
| 4 | Devon Conway | 29 | 1,080 | 43.20 | 139.72 |
| 5 | Heinrich Klaasen | 64 | 2,104 | 42.08 | 166.72 |
Highest IPL batting average with 2,000+ runs
The answer is still Sai Sudharsan — 48.37.
He has crossed 2,500 IPL runs while maintaining an average above 48. That combination of volume and consistency is the main reason he sits at the top of the career leaderboard.
| Rank | Player | IPL Matches | Total Runs | Batting Average | Strike Rate |
|---|---|---|---|---|---|
| 1 | Sai Sudharsan | 57 | 2,515 | 48.37 | 149.17 |
| 2 | KL Rahul | 159 | 5,815 | 46.15 | 139.15 |
| 3 | Heinrich Klaasen | 64 | 2,104 | 42.08 | 166.72 |
| 4 | David Warner | 184 | 6,565 | 40.52 | 139.77 |
| 5 | Virat Kohli | 283 | 9,336 | 40.42 | 134.80 |
Highest IPL batting average with 3,000+ runs
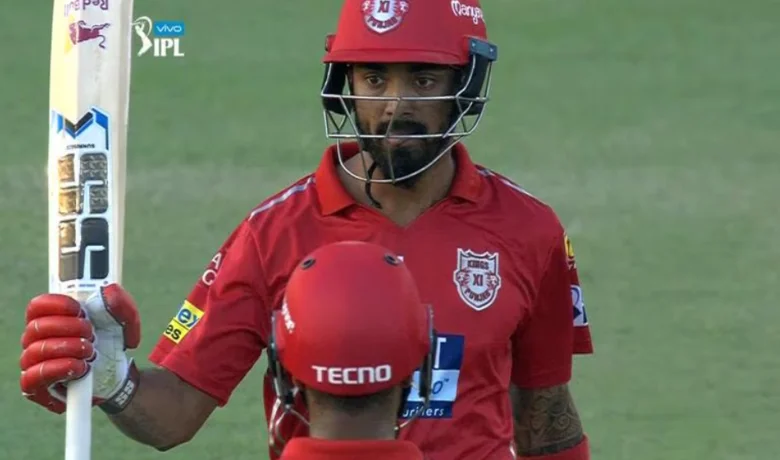
Once the qualification rises to 3,000 IPL runs, KL Rahul becomes the leader at 46.15.
David Warner follows at 40.52, while Virat Kohli is at 40.42. Shubman Gill is close behind at 40.33.
This threshold shows why average alone does not tell the entire story. Sai has the better career average, but KL Rahul has more than twice the number of IPL runs.
| Rank | Player | IPL Matches | Total Runs | Batting Average | Strike Rate |
|---|---|---|---|---|---|
| 1 | KL Rahul | 159 | 5,815 | 46.15 | 139.15 |
| 2 | David Warner | 184 | 6,565 | 40.52 | 139.77 |
| 3 | Virat Kohli | 283 | 9,336 | 40.42 | 134.80 |
| 4 | Shubman Gill | 134 | 4,598 | 40.33 | 142.09 |
| 5 | Chris Gayle | 142 | 4,965 | 39.72 | 148.96 |
Highest IPL batting average with 5,000+ runs
Among players with at least 5,000 IPL runs, KL Rahul remains the leader at 46.15.
The leading group includes:
| Player | Runs | Average |
|---|---|---|
| KL Rahul | 5,815 | 46.15 |
| David Warner | 6,565 | 40.52 |
| Virat Kohli | 9,336 | 40.42 |
| AB de Villiers | 5,162 | 39.70 |
| MS Dhoni | 5,439 | 38.30 |
| Shikhar Dhawan | 6,769 | 35.26 |
| Suresh Raina | 5,528 | 32.52 |
| Rohit Sharma | 7,329 | 29.91 |
These figures illustrate the difference between the highest career average and the strongest combination of longevity, runs and consistency.
Highest Batting Average in IPL With Minimum 50 Innings
A minimum of 50 innings removes most short-career outliers.
Sai Sudharsan qualifies with 57 innings and still leads with 48.37.
KL Rahul, with 150 innings, is second at 46.15. The next major long-career performers include David Warner, Virat Kohli, Shubman Gill and Shaun Marsh.
This is one of the strongest ways to evaluate the best batting averages in IPL history because the players have had enough opportunities for their numbers to stabilize.
| Rank | Player | IPL Matches | Innings | Total Runs | Batting Average | Strike Rate |
|---|---|---|---|---|---|---|
| 1 | Sai Sudharsan | 57 | 57 | 2,515 | 48.37 | 149.17 |
| 2 | KL Rahul | 159 | 150 | 5,815 | 46.15 | 139.15 |
| 3 | Heinrich Klaasen | 64 | 60 | 2,104 | 42.08 | 166.72 |
| 4 | David Warner | 184 | 184 | 6,565 | 40.52 | 139.77 |
| 5 | Virat Kohli | 283 | 275 | 9,336 | 40.42 | 134.80 |
Highest Batting Average in IPL With Minimum 20 Matches
A 20-match requirement produces a slightly different picture from the 50-innings test.
Sai Sudharsan still leads at 48.37.
KL Rahul is second at 46.15, while Vaibhav Sooryavanshi is third with 44.70 after 23 matches. Devon Conway and Heinrich Klaasen are also among the leading players under this qualification.
The 20-match rule removes players whose averages were produced in only a few appearances but still rewards players who have been able to make an impact relatively quickly.
| Rank | Player | IPL Matches | Innings | Total Runs | Batting Average | Strike Rate |
|---|---|---|---|---|---|---|
| 1 | Sai Sudharsan | 57 | 57 | 2,515 | 48.37 | 149.17 |
| 2 | KL Rahul | 159 | 150 | 5,815 | 46.15 | 139.15 |
| 3 | Vaibhav Sooryavanshi | 23 | 23 | 1,028 | 44.70 | 228.95 |
| 4 | Devon Conway | 29 | 28 | 1,080 | 43.20 | 139.72 |
| 5 | Heinrich Klaasen | 64 | 60 | 2,104 | 42.08 | 166.72 |
Highest Batting Average in IPL Among Indian Batsmen
Among Indian players, the leading career averages are:
| Player | IPL Runs | Average |
|---|---|---|
| Sai Sudharsan | 2,515 | 48.37 |
| KL Rahul | 5,815 | 46.15 |
| Vaibhav Sooryavanshi | 1,028 | 44.70 |
| Virat Kohli | 9,336 | 40.42 |
| Shubman Gill | 4,598 | 40.33 |
| Ruturaj Gaikwad | 2,839 | 38.36 |
Sai advantage is particularly notable because he combines a high average with more than 2,500 runs. Kohli, meanwhile, has maintained a 40-plus average over 275 IPL innings and remains the league leading run-scorer.
For a broader look at one of India’s most technically consistent former batters, see our article on Rahul Dravid biography.
Highest Batting Average in IPL Among Overseas Batsmen
Among overseas IPL batters, the leading averages in the current career data include Hashim Amla at 44.38,Devon Conway at 43.20 and Heinrich Klaasen at 42.08.
| Player | IPL Runs | Average |
|---|---|---|
| Hashim Amla | 577 | 44.38 |
| Devon Conway | 1,080 | 43.20 |
| Heinrich Klaasen | 2,104 | 42.08 |
| David Warner | 6,565 | 40.52 |
| Lendl Simmons | 1,079 | 39.96 |
| Chris Gayle | 4,965 | 39.72 |
| Jos Buttler | 4,646 | 39.71 |
| AB de Villiers | 5,162 | 39.70 |
Amla number came from a much smaller IPL career than Warner, so it should not be compared without considering the sample size.
Highest Batting Average in IPL 2026
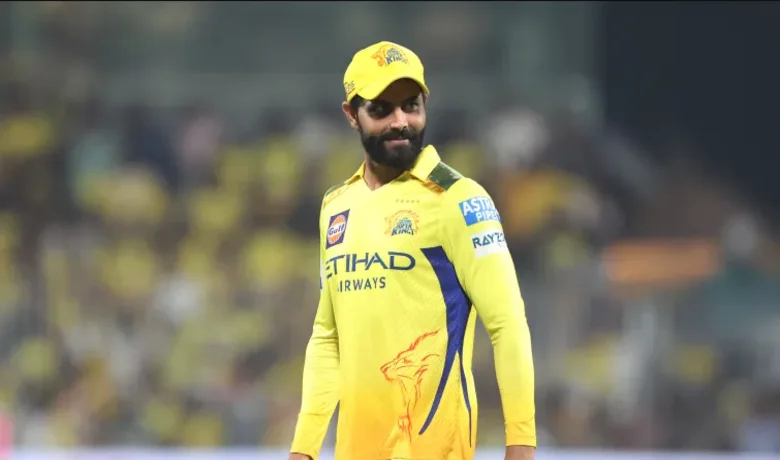
The answer changes when the comparison is restricted to one season.
In IPL 2026, Ravindra Jadeja recorded the highest batting average in the available season statistics at 66.50, scoring 266 runs in 11 innings. Quinton de Kock was second at 66.00 from only three innings, followed by Rinku Singh at 59.00 from 11 innings.
Here are the leading 2026 averages:
| Rank | Player | Runs | Innings | Average |
|---|---|---|---|---|
| 1 | Ravindra Jadeja | 266 | 11 | 66.50 |
| 2 | Quinton de Kock | 132 | 3 | 66.00 |
| 3 | Rinku Singh | 295 | 11 | 59.00 |
| 4 | Anshul Kamboj | 58 | 4 | 58.00 |
| 5 | Virat Kohli | 675 | 16 | 56.25 |
| 6 | Shreyas Iyer | 498 | 13 | 55.33 |
| 7 | Josh Inglis | 266 | 5 | 53.20 |
| 8 | Venkatesh Iyer | 209 | 6 | 52.25 |
| 9 | Corbin Bosch | 50 | 4 | 50.00 |
| 10 | Vaibhav Sooryavanshi | 776 | 16 | 48.50 |
The table also shows why the phrase highest batting average in IPL qualification matters. Quinton de Kock 66.00 is impressive, but it came from only three innings. Virat Kohli 56.25 came from 16 innings and 675 runs, making his figure much stronger for a full-season comparison.
Highest Batting Average in IPL 2025
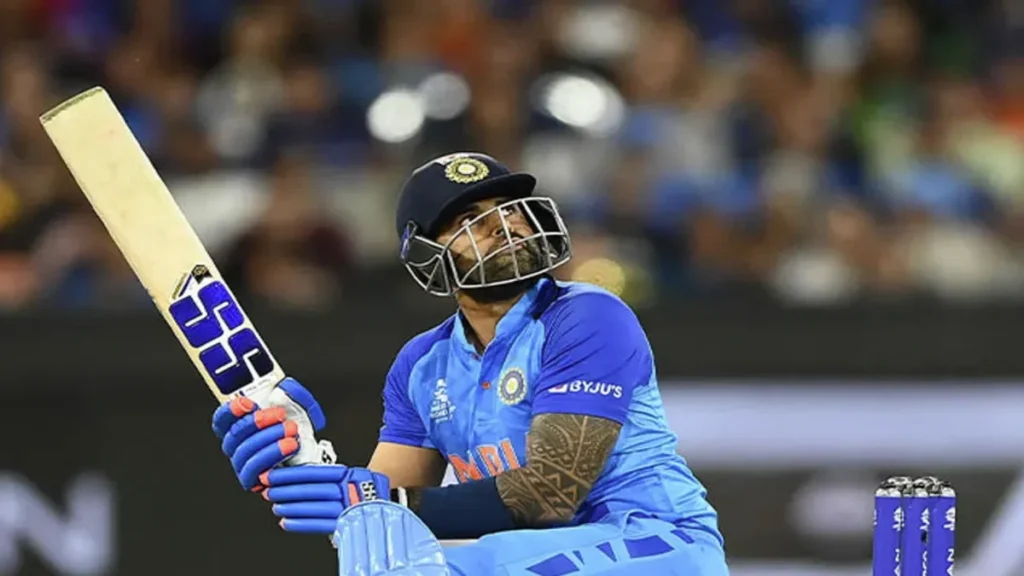
Suryakumar Yadav produced the highest batting average among the leading 2025 season performers, finishing with 717 runs at 65.18 in 16 matches and innings.
He was followed by Tim David at 62.33, Jos Buttler at 59.78, Virat Kohli at 54.75 and Sai Sudharsan at 54.21.
Sai 2025 season deserves special attention because he scored 759 runs, won the Orange Cap and still averaged more than 54.
| Rank | Player | Team | Matches | Runs | Batting Average |
|---|---|---|---|---|---|
| 1 | Suryakumar Yadav | Mumbai Indians (MI) | 16 | 717 | 65.18 |
| 2 | Tim David | Royal Challengers Bengaluru (RCB) | 12 | 187 | 62.33 |
| 3 | Jos Buttler | Gujarat Titans (GT) | 14 | 538 | 59.78 |
| 4 | Virat Kohli | Royal Challengers Bengaluru (RCB) | 15 | 657 | 54.75 |
| 5 | Sai Sudharsan | Gujarat Titans (GT) | 15 | 759 | 54.21 |
Highest Batting Average in a Single IPL Season
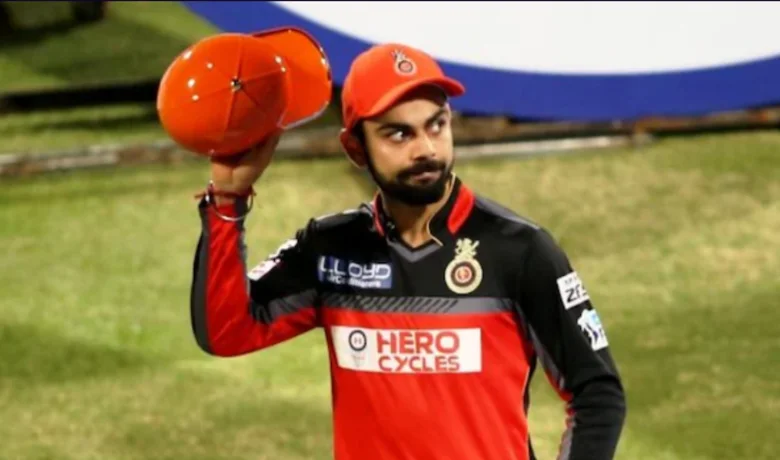
The most remarkable high-volume individual season remains Virat Kohli 2016 campaign.
Kohli scored 973 runs in 16 innings at an average of 81.08, with four centuries.The 973-run total remains the highest number of runs scored by a player in a single IPL season.
Some of the leading high-volume season averages are:
| Player | Season | Runs | Average |
|---|---|---|---|
| Virat Kohli | 2016 | 973 | 81.08 |
| Shubman Gill | 2023 | 890 | 59.33 |
| Jos Buttler | 2022 | 863 | 57.53 |
| David Warner | 2016 | 848 | 60.57 |
| Virat Kohli | 2024 | 741 | 61.75 |
| B. Sai Sudharsan | 2025 | 759 | 54.21 |
| Virat Kohli | 2026 | 675 | 56.25 |
Kohli 2016 season is especially impressive because the 81.08 average came with a huge workload rather than a handful of appearances.
Why Is Batting Average Important in IPL?
A batting average provides an answer to a different question from total runs.
Total runs tell us how much a player contributed over the course of his career or season. Average tells us how many runs he produced each time he was dismissed.
That distinction matters in T20 cricket because batting roles are different. Some players attack immediately and accept a higher risk of dismissal Others bat through the innings and protect their wicket while scoring consistently.
A high average often indicates a combination of:
- regular run production
- the ability to convert starts into substantial scores
- fewer dismissals
- strong finishing or chasing ability
- consistency across multiple matches
But average should never be viewed alone. A batter averaging 45 at a strike rate of 120 has a very different impact from one averaging 40 at a strike rate above 160.
Difference Between IPL Batting Average and Strike Rate
The difference between IPL batting average and strike rate is simple:
Batting average measures runs scored per dismissal.
Strike rate measures runs scored per 100 balls faced.
For example, Virat Kohli IPL career average is about 40.42, while his career strike rate is about 134.80.Vaibhav Sooryavanshi, by contrast, has a career average of 44.70 but a remarkable strike rate of 228.95.
That comparison demonstrates why the highest batting average vs highest strike rate in IPL is not the same contest.
A high-average batter is not automatically the fastest scorer, and the highest strike-rate player is not necessarily the most consistent.
Highest Runs and Batting Average in IPL
Virat Kohli provides perhaps the clearest example of the difference between volume and average.
By the end of IPL 2026, Kohli had scored 9,336 IPL runs, including 68 fifties and nine centuries, while maintaining a career average of approximately 40.42. Reuters also confirmed that he extended his position as the league’s all-time leading run-scorer in the 2026 final.
Sai Sudharsan has a considerably smaller career sample but a much higher average of 48.37. KL Rahul sits between those two extremes: 5,815 runs and a 46.15 average.
That is why the question of who has the best IPL batting performance by average should always be accompanied by a question about workload.
Who Has the Best Average Without Being Not Out?

This is an unusual way to rank batters, but it highlights an important part of the batting-average formula.
A player who has never been not out has his entire run total divided by every innings. Vaibhav Sooryavanshi currently stands out among the major career-average leaders because he has 0 not-outs, yet has scored 1,028 runs in 23 IPL innings for a 44.70 average.
That makes his average especially striking because it is not being boosted by unbeaten innings.
| Rank | Player | Matches | Innings | Runs | Not Outs | Batting Average |
|---|---|---|---|---|---|---|
| 1 | Sai Sudharsan | 57 | 57 | 2,515 | 5 | 48.37 |
| 2 | KL Rahul | 159 | 150 | 5,815 | 24 | 46.15 |
| 3 | Vaibhav Sooryavanshi | 23 | 23 | 1,028 | 0 | 44.70 |
| 4 | Jean-Paul Duminy | 73 | 67 | 1,824 | 26 | 44.49 |
| 5 | Devon Conway | 29 | 28 | 1,080 | 3 | 43.20 |
How Is Batting Average Calculated in IPL?
The calculation is straightforward:
IPL Batting Average = Runs ÷ Dismissals
To find dismissals:
Dismissals = Innings − Not-Out Innings
Suppose a batter has:
- 1,000 runs
- 25 innings
- 5 not-outs
He has been dismissed 20 times.
1,000 ÷ 20 = 50.00
His IPL batting average is therefore 50.00.
A not-out innings is not counted as a dismissal. This is why two players with the same number of runs can have very different averages.
Why Small Samples Can Distort the IPL Batting Average Leaderboard
The biggest problem with raw batting-average rankings is sample size.
A player who scores 132 not out in three innings can have an average of 66.00. That is outstanding, but it does not have the same statistical weight as a 46.15 average maintained over 150 innings.
The 2026 season illustrates this perfectly.Quinton de Kock averaged 66.00 after three innings, while Virat Kohli averaged 56.25 across all 16 innings.
This is why searches for the top 10 highest batting averages in IPL or top 20 highest batting averages in IPL should always state the qualification. Without one, the ranking can mix established stars with players who have barely appeared.
Batting Average vs Total Runs: Which Is Better?
Neither statistic is enough on its own.
For measuring longevity and overall output, total runs are more useful. Virat Kohli 9,336 runs show an extraordinary level of sustained IPL participation and production.
For measuring consistency per dismissal, average is more informative. Sai Sudharsan’s 48.37 is the strongest number on the current career leaderboard.
The best player comparisons therefore combine:
Runs + Average + Strike Rate + Innings + Not Outs
That provides a much clearer picture of IPL batting performance than any single statistic.
For more background on another iconic Indian run-scorer, readers can also explore our Sachin Tendulkar biography.
Top IPL Batsmen by Batting Average: Key Takeaways
The current records reveal several interesting patterns.
Sai Sudharsan leads the career batting average table at 48.37. His 2,515 runs show that his average is backed by a substantial IPL workload.
KL Rahul is the leader among players with 3,000-plus and 5,000-plus runs. His 46.15 average has been sustained over 150 innings and 159 matches.
Vaibhav Sooryavanshi is already third overall after a very short career, but his 1,028 runs in 23 innings provide much more weight to the number than a typical early-career sample.
Virat Kohli combines enormous volume with a 40-plus career average. His 9,336 runs and 40.42 average make him one of the strongest examples of long-term IPL consistency.
The 2026 season leader was Ravindra Jadeja at 66.50, while Kohli’s 56.25 was the leading mark among the season’s major run scorers.
Conclusion
The highest batting average in IPL history is currently Sai Sudharsan’s 48.37, followed by KL Rahul at 46.15 and Vaibhav Sooryavanshi at 44.70 among the established career leaderboard.
But the best batting average depends on the qualification. Small-sample players can produce enormous numbers, while a high average maintained over 50 or 100 innings tells a much stronger story about consistency.
For long-term IPL performance, the most useful approach is to combine batting average with total runs, strike rate, innings and not-outs. That gives a clearer picture of which batsmen have truly maintained elite batting performance over time.
FAQ
Who has the best batting average in IPL history?
Sai Sudharsan leads the current career leaderboard with a batting average of 48.37. KL Rahul is second at 46.15.
What is the difference between batting average and strike rate in IPL?
Batting average measures runs per dismissal, while strike rate measures runs scored per 100 balls. A player can have a high average but a moderate strike rate, or a high strike rate with a lower average.
Who had the highest batting average in a single IPL season?
Virat Kohli recorded an 81.08 batting average in IPL 2016, when he scored 973 runs in 16 innings.