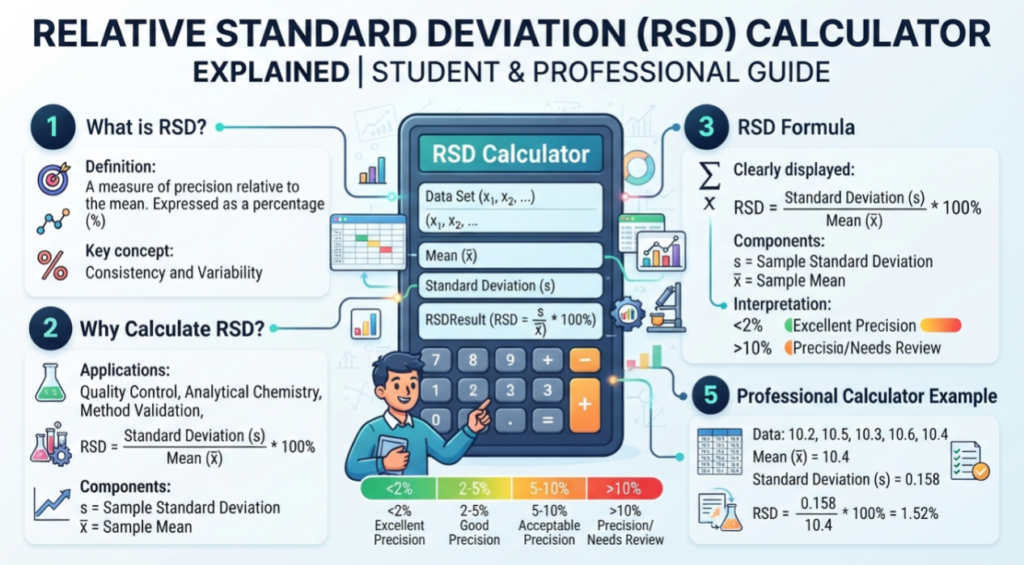

Statistics plays an important role in education, scientific research, engineering, business analysis, healthcare, and quality control. Whenever multiple measurements are collected, it becomes essential to evaluate not only the average value but also how consistent those measurements are. Two datasets may have identical averages while displaying very different levels of variation. Understanding this variation helps determine the reliability and precision of collected data. One of the most widely used statistical measures for evaluating consistency is relative standard deviation, commonly referred to as RSD.
Relative standard deviation expresses the standard deviation as a percentage of the mean. Because it uses percentages rather than raw values, it allows meaningful comparisons between datasets with different units or scales. This makes RSD an extremely useful measurement for students learning statistics as well as professionals who regularly analyze experimental or operational data.
Why Data Precision Matters
Accurate data forms the foundation of informed decision-making. Whether conducting laboratory experiments, monitoring manufacturing quality, analyzing financial performance, or completing academic research, consistent measurements increase confidence in the results. If repeated observations vary significantly from one another, conclusions based on that data become less reliable.
Measuring variability helps identify possible errors, equipment limitations, environmental influences, or inconsistencies in testing procedures. By evaluating both average values and variation, analysts gain a more complete understanding of data quality. Relative standard deviation provides an efficient way to summarize this information into a single percentage that is easy to interpret.
The Relationship Between Mean and Standard Deviation
Before understanding relative standard deviation, it is helpful to understand the concepts on which it depends. The arithmetic mean represents the average value within a dataset, while the standard deviation measures how widely individual observations are spread around that average.
A dataset with a small standard deviation contains values that remain close to the mean, indicating strong consistency. A larger standard deviation suggests greater variability among observations. Relative standard deviation combines these two measures by dividing the standard deviation by the mean and expressing the result as a percentage. This standardized approach allows users to compare precision across completely different datasets.
Why Students Benefit from RSD Calculators
Many students encounter relative standard deviation during mathematics, statistics, chemistry, biology, engineering, and laboratory courses. Although the underlying formula is straightforward, calculating RSD manually often requires several mathematical steps. Students must first calculate the average, determine individual deviations, compute the standard deviation, and finally convert the result into a percentage.
Using a relative standard deviation calculator simplifies this learning process by performing calculations instantly while allowing students to focus on understanding statistical concepts rather than repetitive arithmetic. Instead of spending valuable time checking calculations, students can interpret results more effectively and gain a deeper appreciation of how statistical variation influences scientific conclusions.
Supporting Professional Data Analysis
Professionals across many industries rely on statistical accuracy to evaluate processes, monitor quality, and support important decisions. Laboratory scientists compare experimental results, pharmaceutical manufacturers verify product consistency, engineers monitor production performance, and financial analysts evaluate investment volatility.
A relative standard deviation calculator enables professionals to analyze datasets efficiently while minimizing calculation errors. Fast and reliable calculations support quicker reporting, improved productivity, and greater confidence in analytical results. As organizations increasingly rely on data-driven decision-making, automated statistical tools have become valuable resources for improving operational efficiency.
Applications Across Different Industries
Relative standard deviation has practical applications in nearly every industry that depends on measurement and analysis. Scientific laboratories use RSD to determine whether repeated experiments produce reliable results. Pharmaceutical companies evaluate manufacturing consistency to ensure medications meet strict quality standards. Environmental researchers analyze water, soil, and air samples while monitoring measurement reliability.
Manufacturing organizations use relative standard deviation to monitor product quality across production batches. Financial analysts compare investment performance while accounting for market fluctuations. Healthcare researchers evaluate diagnostic testing consistency and medical research outcomes. Educational institutions teach RSD as part of statistical literacy, preparing students for future careers involving data analysis.
Advantages of Online Statistical Tools
Digital technology has significantly simplified statistical analysis. Instead of manually performing complex calculations using spreadsheets or calculators, users can now access online statistical tools from virtually any device with an internet connection. These tools provide immediate results while reducing the possibility of arithmetic mistakes.
Online calculators are particularly valuable for large datasets where manual calculations become increasingly time-consuming. By automating mathematical processes, users can devote more attention to understanding patterns, identifying trends, and making informed decisions based on statistical evidence.
Interpreting Relative Standard Deviation Results
Calculating relative standard deviation is only the first step. Understanding what the results indicate is equally important. Lower RSD percentages generally reflect greater measurement precision because observations remain closely grouped around the average. Higher percentages indicate greater variability, suggesting less consistent measurements.
Acceptable RSD values depend on the specific field, measurement method, and intended application. Highly controlled scientific experiments often require very low RSD values, while fields influenced by natural variability may accept higher percentages. Context remains essential when evaluating statistical precision.
Common Challenges in Manual Calculations
Manual statistical calculations introduce opportunities for error, particularly when working with large datasets or performing repetitive analyses. Small arithmetic mistakes, incorrect averages, misplaced decimal points, or improper standard deviation formulas can significantly affect final results.
Automated statistical tools eliminate many of these risks by consistently applying validated mathematical formulas. Although users should always verify that data has been entered correctly, automated calculations improve accuracy while reducing unnecessary workload. This reliability becomes increasingly valuable in both academic and professional environments.
Building Strong Statistical Skills
Understanding statistical concepts extends far beyond passing examinations or completing laboratory assignments. Modern organizations increasingly rely on data analysis to guide strategic planning, operational improvements, product development, and scientific research. Professionals capable of interpreting statistical measurements possess valuable analytical skills that remain relevant across numerous industries.
Learning how relative standard deviation measures consistency strengthens critical thinking while improving the ability to evaluate research findings objectively. Combining theoretical knowledge with practical calculation tools enables students and professionals to develop greater confidence when working with quantitative information.
The Future of Data Analysis
Advancements in artificial intelligence, cloud computing, and data analytics continue transforming statistical analysis. Automated platforms increasingly integrate advanced calculations, visualization tools, and predictive analytics that help users interpret complex datasets more efficiently.
Despite these technological advances, understanding fundamental statistical concepts remains essential. Professionals who combine strong statistical knowledge with modern analytical tools will be better prepared to solve increasingly complex problems while supporting evidence-based decision-making across diverse industries.
Conclusion
Relative standard deviation is one of the most valuable statistical measurements for evaluating precision and consistency within a dataset. By expressing variability as a percentage of the mean, it provides an easy-to-understand comparison across different measurements, experiments, and industries. Students benefit from learning how RSD supports scientific reasoning, while professionals rely on it to maintain quality, improve accuracy, and support informed decision-making.
Modern calculation tools have made statistical analysis faster, more accessible, and more reliable than ever before. Whether analyzing laboratory results, evaluating manufacturing performance, conducting research, or completing academic assignments, understanding relative standard deviation and using reliable calculation tools helps ensure greater confidence in every dataset. As data-driven decision-making continues expanding across industries, mastering statistical concepts like RSD remains an essential skill for both education and professional success.